
LearnVisual
Interactive Learning Platform with Animations & 3D Visualizations
Overview
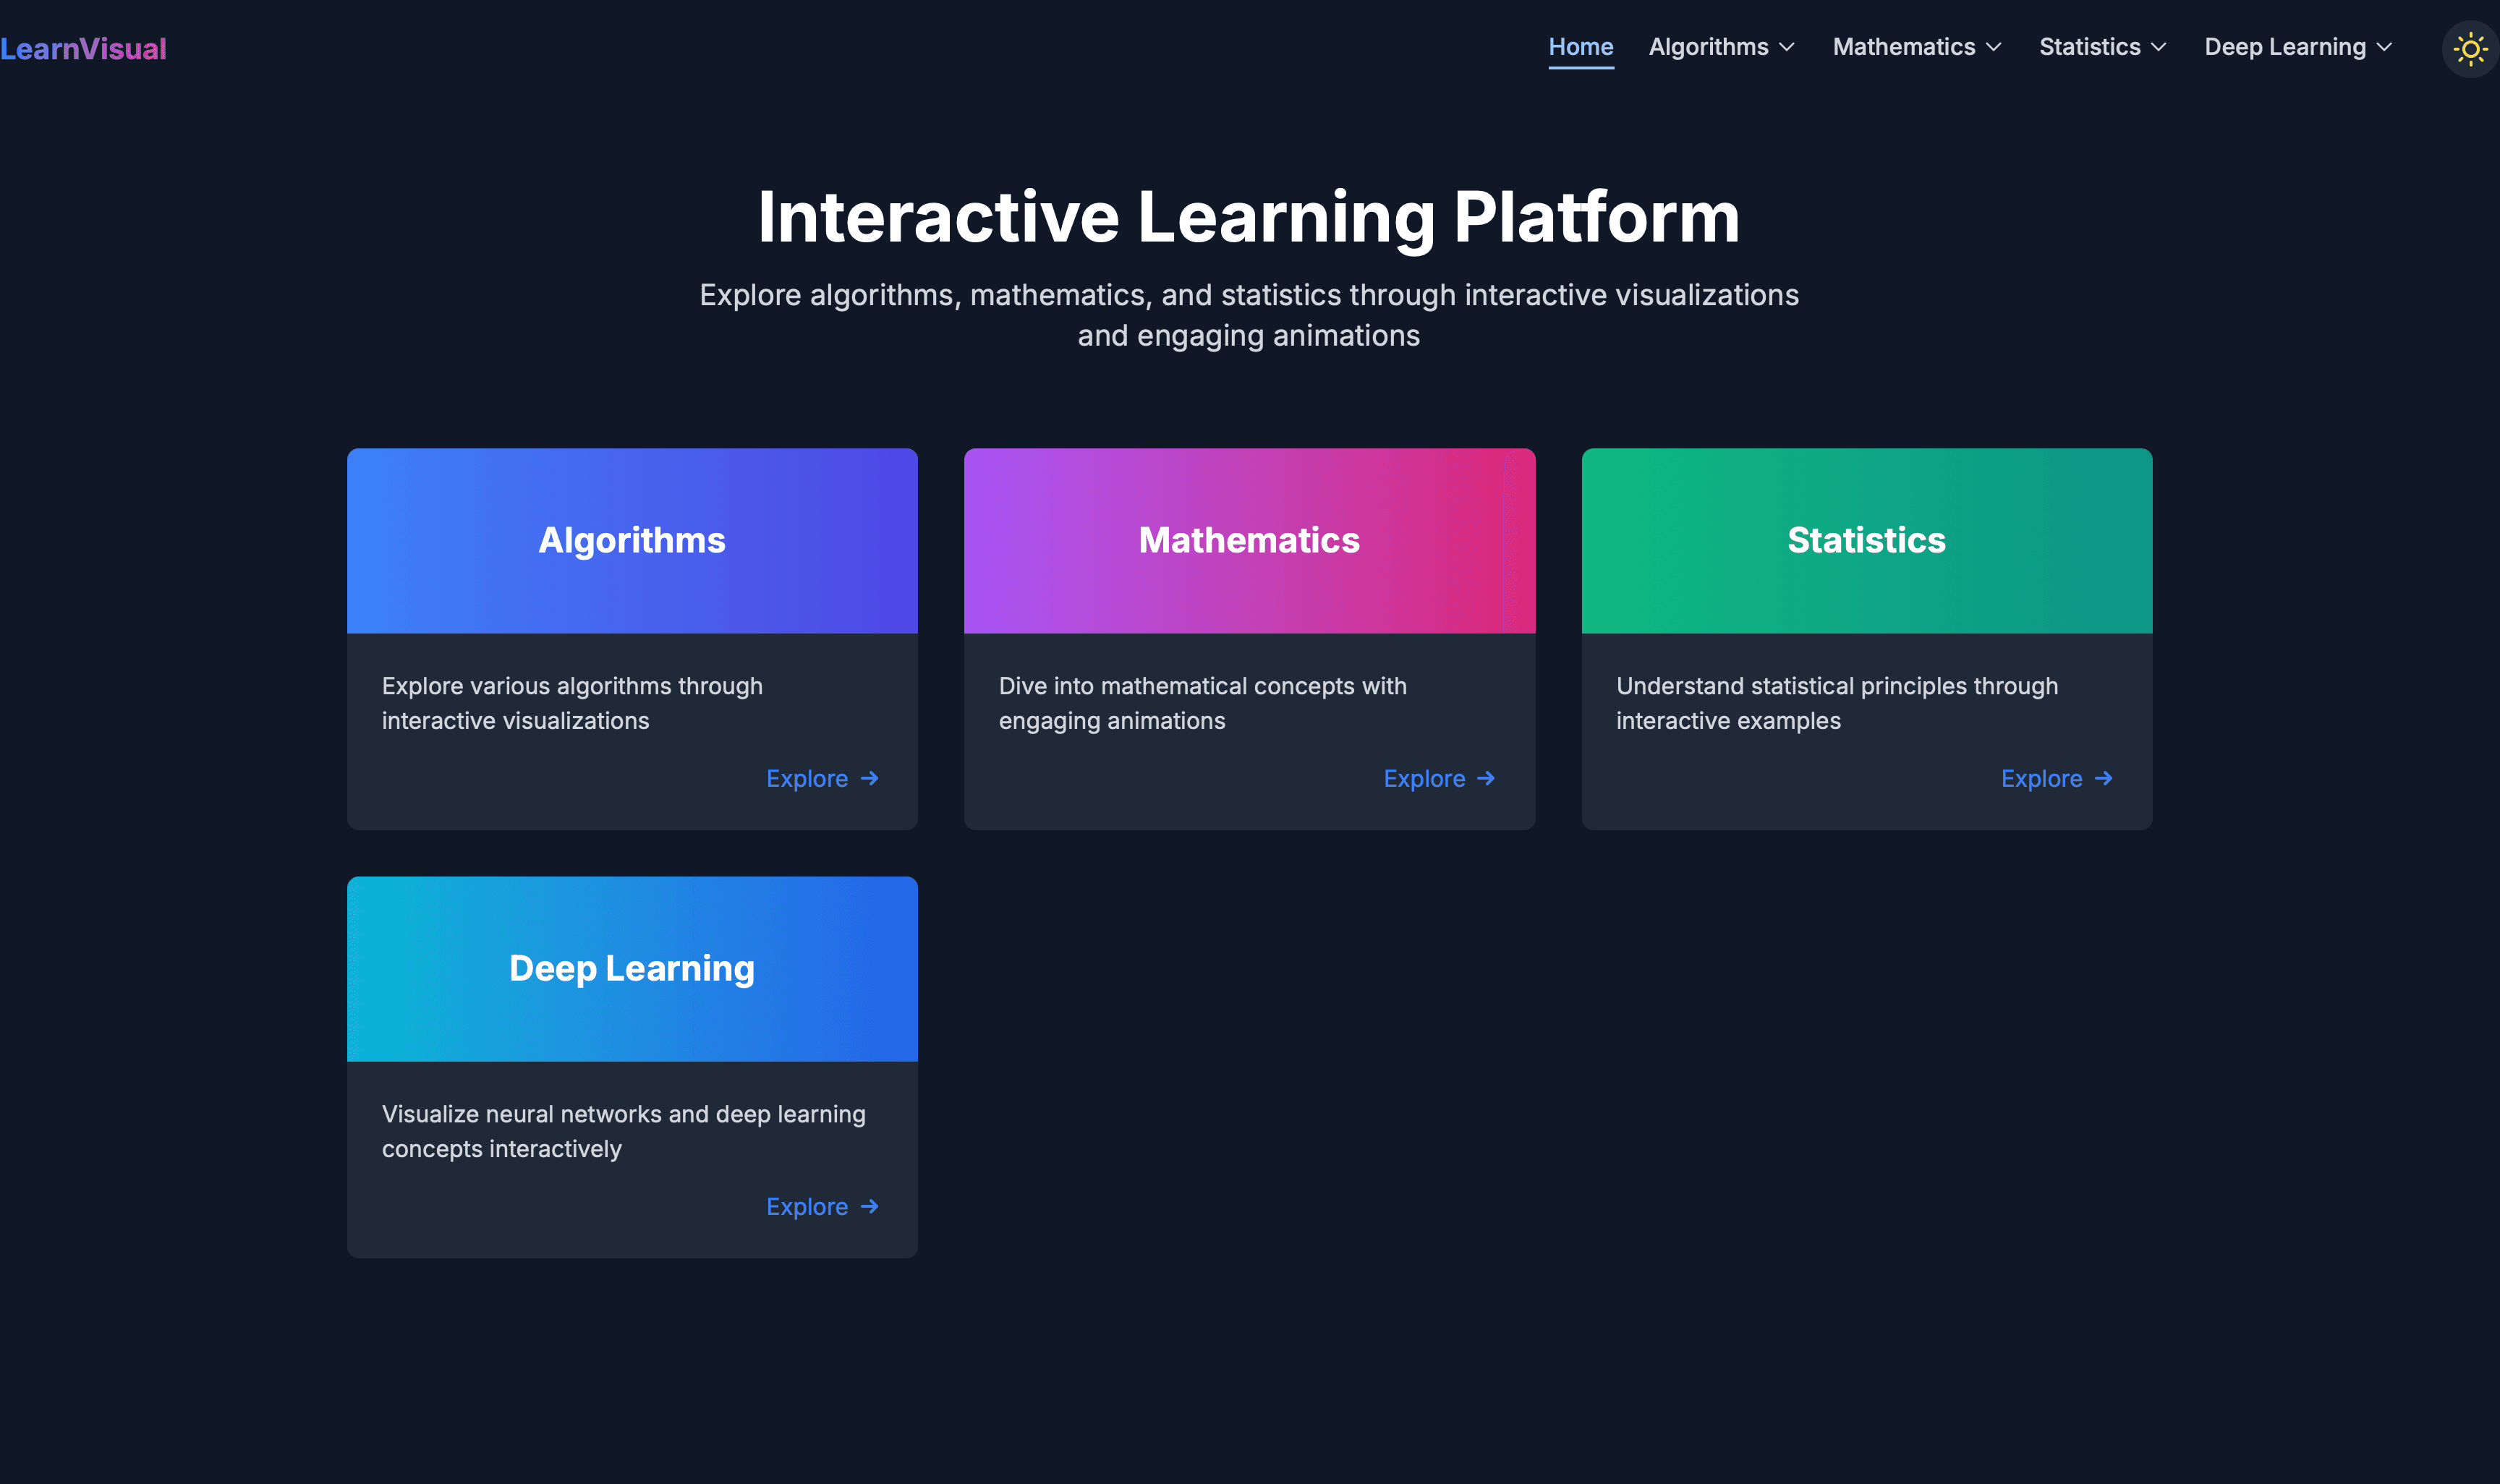
LearnVisual is an innovative educational platform that transforms complex concepts into intuitive, interactive visual experiences. By combining fluid animations, interactive charts, and 3D models, learning becomes engaging and memorable. The platform makes difficult subjects accessible through visualization, helping students grasp concepts that stick.
Key Features
Fluid Animations
Smooth, engaging animations that bring concepts to life
Interactive Charts
Dynamic data visualizations powered by D3.js and Chart.js
3D Visualizations
Interactive 3D models using Three.js for spatial understanding
Balanced Theory
Appropriate amount of theory paired with visuals
Technical Implementation
Advanced Visualizations
Integrated Three.js for 3D graphics, D3.js for data-driven visualizations, and Chart.js for interactive charts. Each visualization is carefully crafted to enhance understanding while maintaining smooth performance.
Modern Framework
Built with Next.js and React for optimal performance and SEO. The platform leverages server-side rendering for fast initial loads while maintaining rich client-side interactivity.
Technologies Used
React
Next.js
Three.js
D3.js
Chart.js